Built in Germany, tested in the Baltic 🌊

How the data arrives

From buoy to dashboard.

  1. 01

    In the water

    HYDRA measures and sends its readings by LoRaWAN, up to 14 km over open water with a clear line of sight. We support your unique installation process.
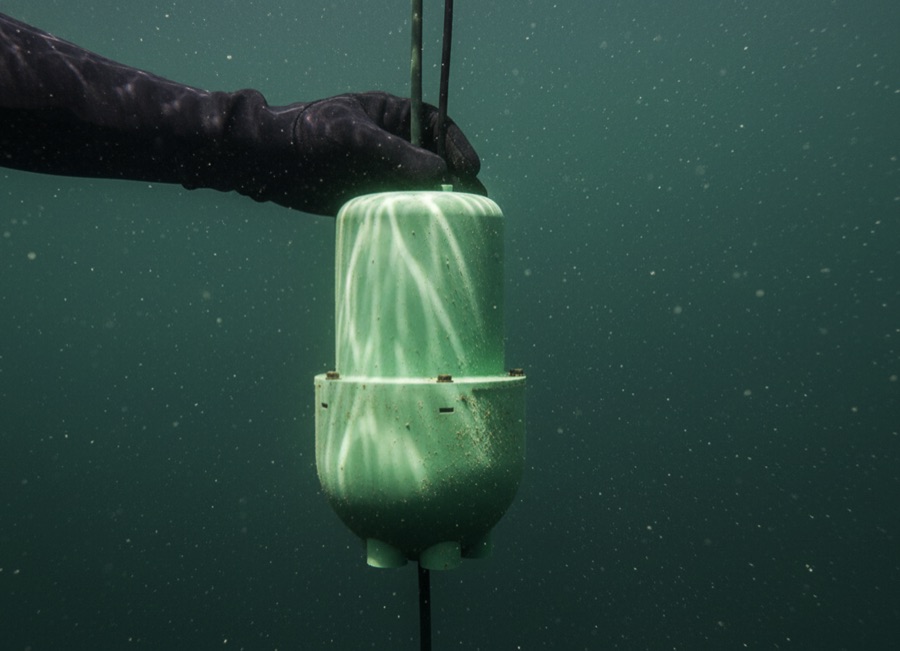
    A diver holds a HYDRA buoy under water
  2. 02

    On shore

    A gateway receives them and forwards them over cable, Wi-Fi or mobile data. It is quoted with your request.

    HYDRAGatewayYour phone
  3. 03

    On your screen

    See on your mobile screen live values, history and alerts.
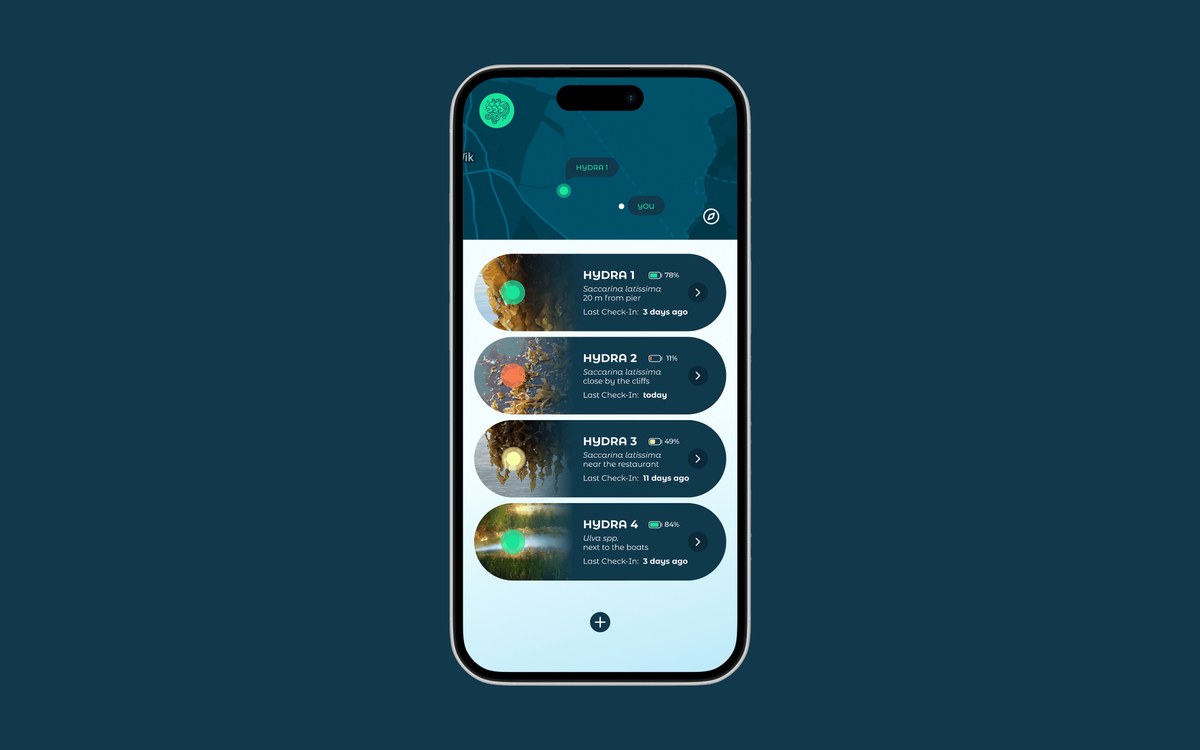
    The web app on a phone: a map and the list of buoys
Built in Temperature Light Waves Add-ons Oxygen Salt content Decay
Illustration

What it measures

Three things built in, three to add.

Built in

  • Water temperature

    How warm or cold the water is.

  • Light

    How much light reaches the water (light intensity).

  • Waves

    How strongly the buoy moves with the water (wave motion and acceleration).

Add what you need

  • Oxygen

    Dissolved oxygen: a core indicator of water condition — can shift within hours.

  • Salt content

    Conductivity: how well the water conducts electricity. In coastal water that is mostly its salt — it shows salinity and freshwater inflow.

  • Decay

    ORP, oxidation-reduction potential: signals oxygen loss and organic breakdown — often shifts before dissolved oxygen does.

Judged by independent panels on design and sustainability —
not just claimed by us.
Winner, German Sustainability Award, Design category, 2022 iF Design Talent Award 2021 Green Concept Award, Winner, 2022
Your advantage

See how your water differs from spot to spot.

Conditions change near an inflow, in a sheltered corner, at an exposed edge. HYDRA is affordable enough to cover several of these spots: start with one, add more when you want to see the difference.

Before

One station, one number

A single monitoring station, seen from the shore Open water seen from the coast, with range rings at 5, 10 and 14 kilometres around a gateway on shore. One station reports 15.2 °C. The five other spots in the area are unmeasured question marks. ? ? ? ? ? Gateway on shore 5 km 10 km up to 14 km 15.2 °C

One reading. The rest is assumed.

With HYDRA

A network across the same water

Six HYDRA units kilometres apart, all reporting to one gateway on shore The same water and range rings, now with six units spread several kilometres apart, each linked to the gateway on shore. Four read normal, one reads 1.1 °C warmer, one reads 2.7 °C warmer than the spot a single station would cover. Gateway on shore 5 km 10 km up to 14 km 15.2 °C +2.7 °C +1.1 °C

Six measured — one runs 2.7 °C warmer.

This illustration shows an example.

Get a quote